Most companies measure performance through financial reports. Revenue growth, gross margins and operating profit are typically the main indicators used by founders and leadership teams to evaluate whether the business is performing well. These metrics are important and necessary, but they only show the financial outcome of what has already happened.
What they often fail to explain is why those results occurred. Two companies may report similar revenue and profit margins while operating in completely different ways beneath the surface. One may be operating efficiently with healthy teams and sustainable client relationships, while the other may be relying on overworked employees, unsustainable pricing or concentrated revenue from a small number of clients.
This is where operational data becomes essential. Metrics such as employee capacity, time spent on projects, client acquisition costs and retention rates provide the underlying context behind financial performance. When financial and operational data are combined, CFOs gain a much clearer picture of how the business is truly performing and whether its growth is sustainable.
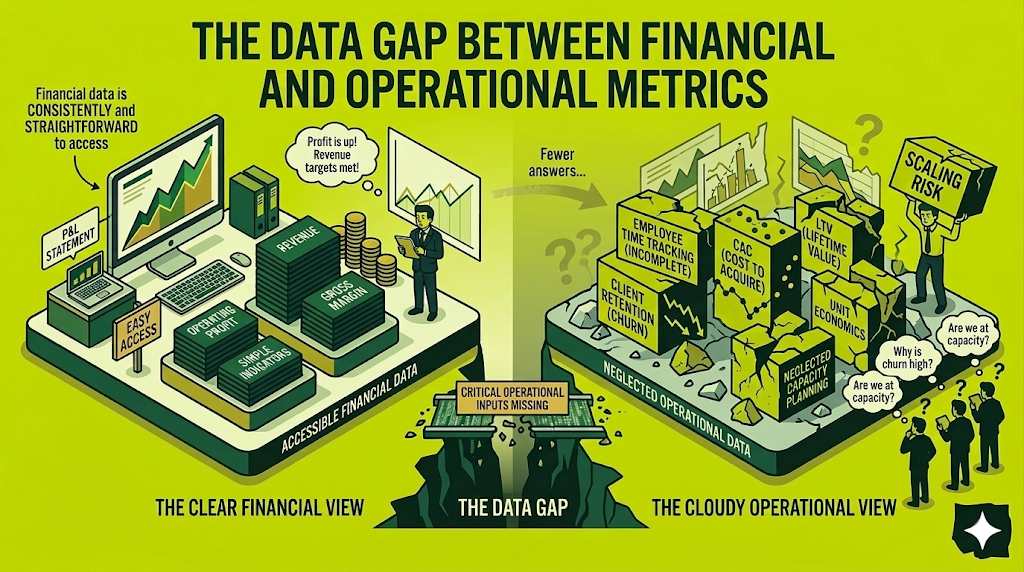
One of the main reasons many companies rely almost entirely on financial metrics is that this data is simply easier to access. Every business knows its revenue and its costs. With even the most basic accounting system, it is straightforward to calculate gross margin, operating profit and other financial indicators. As a result, these metrics naturally become the primary way businesses evaluate performance.
Operational data, however, is rarely captured with the same consistency. Many companies do not have systems in place to track how employees spend their time, how long clients stay with the business, or the real cost of acquiring a new customer. Without this information, leadership teams are left with an incomplete view of what is actually driving their financial results.
For example, most companies can quickly report their revenue for the month. Far fewer can answer questions such as how many hours were spent delivering that revenue, what it cost to acquire the clients generating it, or how long those clients are likely to remain with the business. Without operational inputs like these, it becomes impossible to calculate more refined metrics such as client acquisition cost, lifetime value or the LTV to CAC ratio.
When operational data is introduced alongside financial reporting, the role of finance changes significantly. Instead of only presenting financial outcomes, it becomes possible to link the day to day operations of the business with its financial performance. This is a core part of how we approach reporting with our clients at Quantro.
In practice, this means combining financial data with operational inputs such as employee numbers, client numbers and time tracking reports. When these datasets are connected, businesses can start measuring more meaningful indicators such as client retention rate, client acquisition cost, lifetime value and the LTV to CAC ratio. These metrics provide a clearer view of whether growth is actually sustainable or simply being achieved through increased spending or operational pressure.
Operational metrics are equally important on the internal side of the business. Measures such as revenue per employee, operational capacity and delivery utilisation allow leadership teams to understand whether the organisation is operating efficiently or approaching its limits. Without this level of visibility, companies may see strong financial results on paper while underlying operational pressures are quietly building within the business.
In our experience working with companies at Quantro, one of the most important metrics for understanding the sustainability of a business is the LTV to CAC ratio. This metric compares the lifetime value of a client with the cost required to acquire that client, providing a clear view of the overall return on investment of the company’s growth.
If the ratio is close to 1:1 or lower, it usually means the company is barely breaking even on the clients it acquires, or in some cases even losing money. While revenue may still be growing, the business is effectively spending as much as it earns to acquire those customers. Over time, this creates serious pressure on profitability and cash flow.
For many of our clients, we use a benchmark of around 3:1 as a healthy target. At this level, the lifetime value generated by a client is roughly three times the cost required to acquire them. This provides enough margin to cover operational costs, absorb fluctuations in performance and support sustainable growth over the long term.
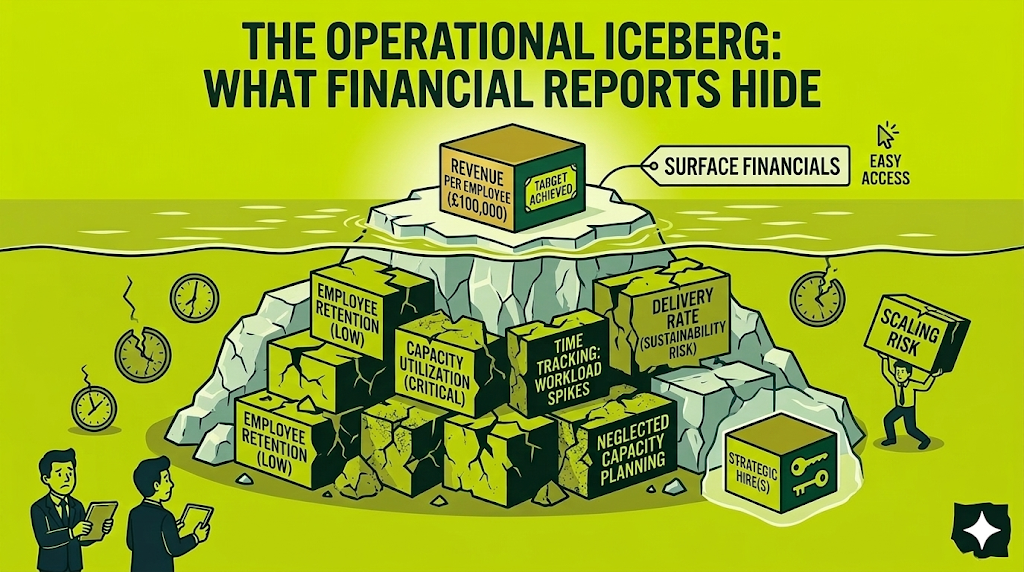
Operational metrics often reveal issues that are not immediately visible in financial reports. One example from our work involved a services business where we were monitoring a key efficiency metric of £100,000 in annual recurring revenue per employee. The company was consistently achieving this target, which initially appeared to be a strong sign of operational efficiency and a well performing team.
However, once we incorporated operational data into the reporting, a different picture started to emerge. When we analysed employee retention figures, operational capacity and time tracking reports, several warning signs appeared. Employee retention was lower than expected, capacity levels were consistently very high and time tracking showed that the team’s delivery rates were significantly above normal levels. In practice, this meant that employees were sustaining a very high workload in order to maintain the company’s revenue targets.
Without these operational insights, the leadership team could easily have interpreted the strong revenue per employee metric as a signal to push for even higher performance. Instead, the data showed that the company was only a few months away from serious operational strain. By identifying this early, we worked with the founder to introduce strategic hires in key positions that helped absorb the pressure across the team.
While the ARR per employee metric dipped slightly for two to three months following these hires, the decision ultimately created the operational capacity required to support the company’s next stage of growth. What initially looked like a decline in efficiency was in fact the adjustment needed to unlock a more sustainable growth trajectory over the following years.
Metrics such as revenue per employee or revenue per client are often seen as indicators of efficiency and strong performance. While this is true to some extent, these metrics should always be interpreted with context. In practice, extremely high numbers can sometimes reveal underlying risks rather than operational strength.
For example, a very high revenue per employee may indicate that the team is operating under excessive pressure. If the business is consistently pushing employees to maintain extremely high productivity levels, this can eventually lead to burnout, lower employee retention and reduced long term performance. Without operational data such as capacity levels, time tracking and employee turnover, these warning signs can remain invisible until problems begin to surface.
A similar risk exists when looking at revenue per client. If a large portion of revenue is concentrated among a small number of clients, the business becomes exposed to concentration risk. In our work, we often monitor the share of revenue generated by the largest clients and introduce alerts when a single client represents an unusually large proportion of total revenue. As a general benchmark, we often aim for the largest client to represent around 15 to 20 percent of total revenue, depending on the structure and size of the business.
Ultimately, these KPIs are not designed to simply be maximised. Their real purpose is to provide context and help leadership teams make better informed decisions about hiring, pricing, growth and risk management.
For many companies, the first step towards combining operational and financial reporting does not require complex systems. In most cases, the initial insights come from simply organising data that already exists within the business.
One of the first things we typically implement when onboarding a new client is tracking the monthly movement of employees and clients. Each month we look at how many employees joined, how many left and the resulting net movement. The same applies to clients. By tracking new clients and client churn each month, companies can immediately start measuring employee retention and client retention rates.
The next step is building a structured list of clients that includes their start date, end date where applicable and the monthly fee they pay. With this information, it becomes possible to calculate the lifetime value of clients and understand the average retainer across the business. These simple datasets already provide significantly more insight into how the company is growing and where potential risks may exist.
From there, companies can gradually build more advanced operational reporting. Introducing time tracking allows businesses to understand delivery capacity and employee utilisation, while analysing advertising spend helps calculate client acquisition cost and marketing return on investment. When these operational reports are combined with financial reporting, leadership teams gain a much clearer and more actionable view of how the business is performing.
The role of the CFO is no longer limited to reporting financial performance. While financial statements remain essential, they are only part of the picture. To truly understand how a business is performing, finance leaders need to connect financial outcomes with the operational drivers that produce them.
When financial and operational data are combined, businesses gain a far clearer understanding of what is actually happening inside the organisation. Leadership teams can see whether growth is being driven by healthy client relationships and sustainable workloads, or whether it is relying on overworked teams, inefficient processes or excessive customer acquisition costs.
For founders and leadership teams, this type of reporting creates a much stronger foundation for decision making. Hiring plans, pricing strategies, marketing spend and client selection can all be guided by data rather than assumptions. Businesses that develop this level of visibility are far better positioned to grow in a sustainable and controlled way.
If you would like to understand how operational and financial reporting can provide deeper insights into your business performance, you can book a meeting with our team to discuss how we support companies in building these reporting frameworks.
More from Quantro
Innovative cash flow management strategies are crucial for any business's survival and growth. In this blog, we cover optimising payment cycles, using financial tools for passive income, leveraging technology for real-time insights, and building a cash-savvy culture. The article provides practical advice, aiming to transform routine financial management into a strategic asset that enhances operational efficiency and financial stability, equipping businesses to navigate complex economic landscapes effectively.
Read More →Explore the complexities of scaling operations in service businesses. We look into recognising the right time to scale, addressing operational challenges, leveraging technology efficiently, maintaining exceptional customer experience, and managing team dynamics effectively. We use practical examples of how to use key performance indicators to navigate growth and ensure that your business not only expands in size but also enhances its capabilities and maintains its core values. Perfect for business leaders seeking to understand the nuances of sustainable growth in the service sector.
Read More →